Case Study: Testing Phase Ads Performance
🎯 Objective
The goal was to test multiple new sales ads to analyze how different creatives perform in terms of reach, CTR (Click-Through Rate), impressions, and cost efficiency before scaling.
🛠️ Setup
Platform: Facebook Ads Manager
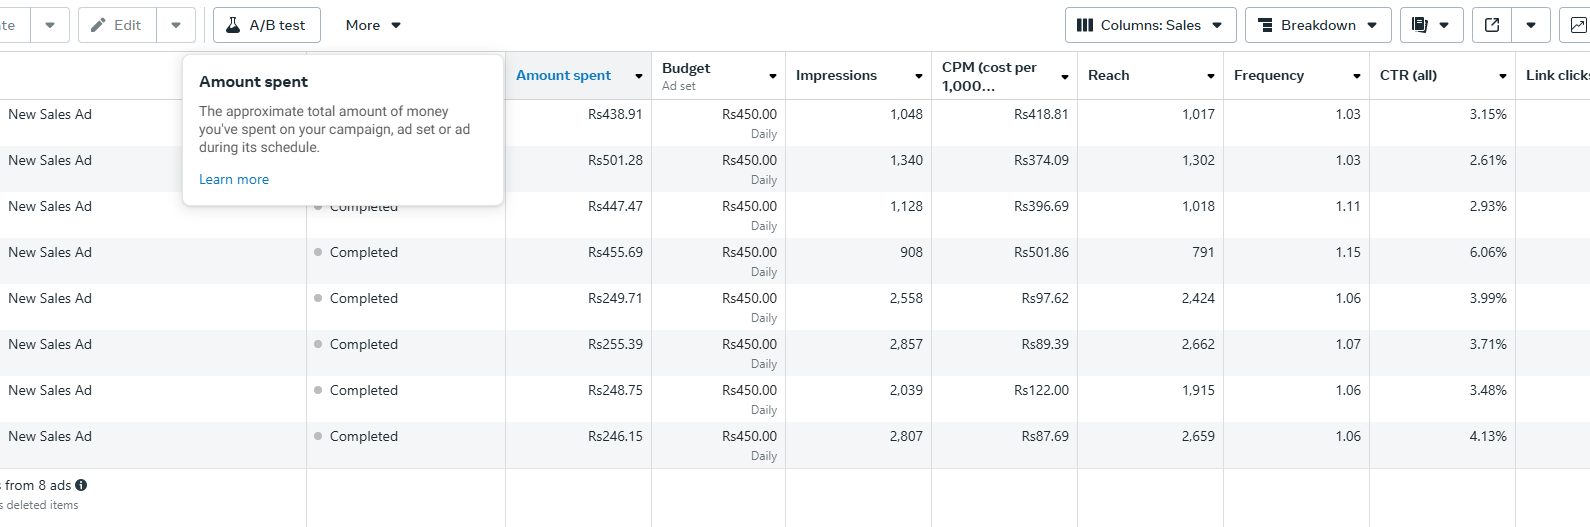
Ad Sets: 8 test ads (“New Sales Ad”)
Daily Budget: Rs. 450 each
Total Spent (Testing Phase): ~Rs. 3,140
Optimization Goal: Identify best-performing ads for CTR & reach at minimum CPM.
One ad achieved 6.06% CTR, showing strong potential for audience engagement.
Ads with lower CPM (Rs. 87 – Rs. 122) also delivered higher reach and cost efficiency.
Frequency stayed low (~1.03–1.15), meaning the audience did not feel ad fatigue.
🔎 Key Insights
High CTR ad (6.06%) → proves strong audience interest in specific creative.
Low CPM ads (~Rs. 87–Rs. 122) → provide cost-efficient scaling opportunities.
Balanced performance → Most ads showed a CTR above industry average (2–3%).
Testing worked → by keeping small budgets, we minimized risk and identified winners.
🚀 Next Steps (Scaling Plan)
Increase budget allocation toward top 2–3 performing ads (highest CTR + lowest CPM).
Duplicate winning ads and test variations (headline, CTA, visuals).
Refine targeting to expand reach without increasing CPM.
Continue monitoring frequency to avoid audience saturation.
✅ Conclusion
This testing phase validated that PixelVictor’s performance marketing approach works:
We don’t rely on assumptions — instead, we test, measure, and scale what actually delivers results. The early signs are highly promising, and with the scaling plan, these ads can generate consistent conversions at an optimized cost.